量化投资第1次作业——MACD策略改进
我选择非必需消费品中的比亚迪(002594.XSHE)作为MACD策略的标的,回测时间为2022.2.28−2022.7.31,原始策略的回测结果如下:
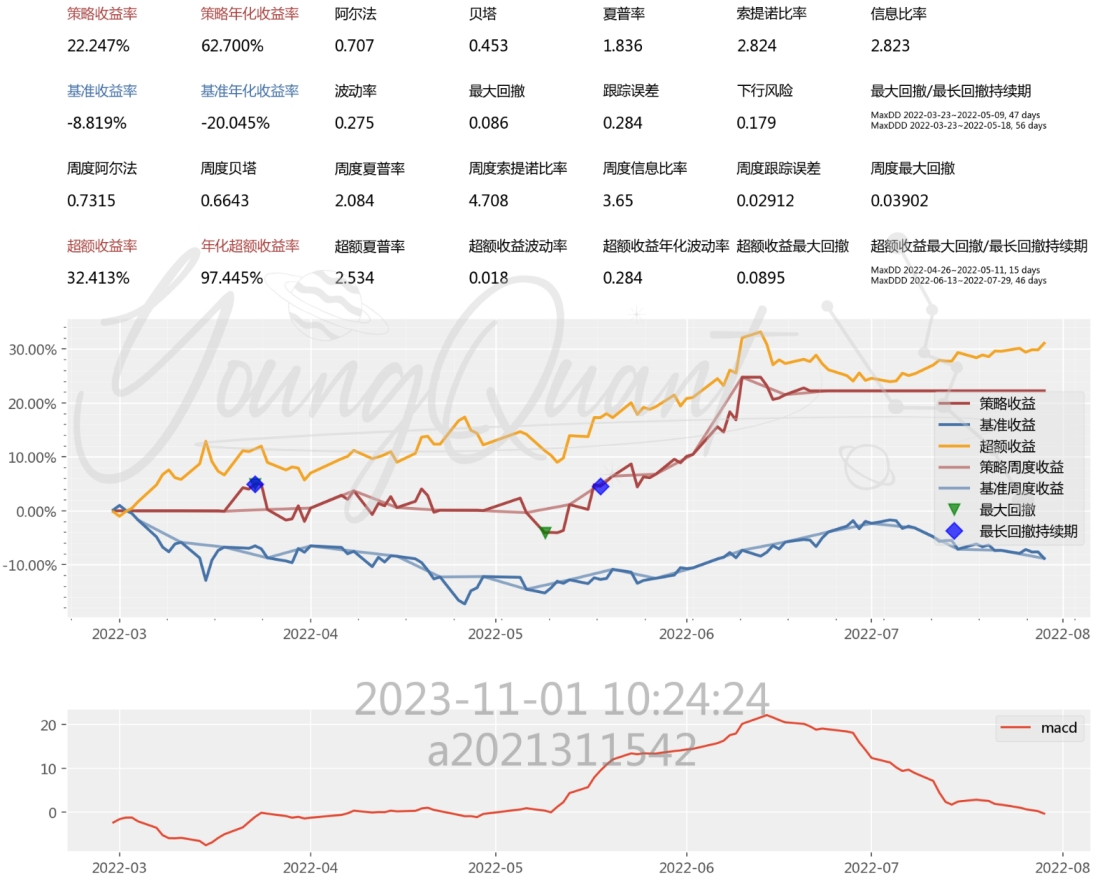
接下来对策略进行优化(在优化调试过程中,我的回测时间为2020.2.28−2022.2.28,一定程度上可以避免优化仅适用于指定回测时间的问题):
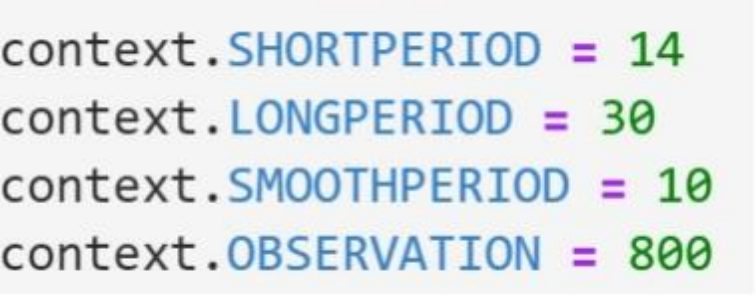
优化一:参数调节
关于MACD参数的确定,广受认可的来源是:相传,在Gerald发明MACD的上世纪70年代,美国交易市场仍在“996”,采用的是单休制度,一周有6个交易日,于是“12”对应的是两周。每个月有4周,一周休息一天,那么30-4=26,“26”对应的是一个月。结合我国国情,可以尝试对各项参数适当放大(其实没什么道理),调整为:
优化二:仓位的确定
在传统的MACD策略中,当出现交易信号时,我们总是全仓买入或清仓卖出,但事实上,并不是每次的交易信号都足够可信,因此我们需要一些足以代表信号强度的指标来确定仓位的大小。从直观感受来看,当DIF突破DEA后,两条线可能就此“分道扬镳”,也有可能重新接近;我们可以认为:“分道扬镳”意味着本次的交易信号非常强烈,可以全仓买入或卖出;而如果两条线后续没有明显分离,则意味着交易信号相对没有那么强烈,可以部分买入或卖出。因此,我们可以根据突破日前后两线的距离差确定仓位的大小,具体来说:
设突破日前后两线距离差分别为d1,d2,对应日期的DEA值为DEA1和DEA2
买入方面:
在买入信号出现的前提下:
若 di>0.05∣DEAi∣ ,i=1,2,则全仓买入;
若$0.03|DEA_i|<d_i<0.05|DEA_i|,\ i=1,2 $,则调整仓位至80%
否则,调整仓位至60%
卖出方面:
在卖出信号出现的前提下:
若 di>0.05∣DEAi∣ ,i=1,2,则清仓卖出;
若$0.02|DEA_i|<d_i<0.05|DEA_i|,\ i=1,2 $,则卖出70%
否则,卖出50
相关代码如下:
1
2
3
4
5
6
7
8
9
10
11
12
13
14
15
16
17
18
19
| if macd[-1] - signal[-1] > abs(0.05*signal[-1]) and macd[-2] - signal[-2] < -abs(0.05*signal[-2]):
order_target_percent(context.s1, 1)
elif macd[-1] - signal[-1] > abs(0.03*signal[-1]) and macd[-2] - signal[-2] < -abs(0.03*signal[-2]):
order_target_percent(context.s1, 0.8)
elif macd[-1] - signal[-1] > 0 and macd[-2] - signal[-2] < 0:
order_target_percent(context.s1, 0.6)
if macd[-1] - signal[-1] < -abs(0.05*signal[-1]) and macd[-2] - signal[-2] > abs(0.05*signal[-2]):
curPosition = context.portfolio.positions[context.s1].quantity
if curPosition > 0:
order_target_value(context.s1, 0)
elif macd[-1] - signal[-1] < -abs(0.02*signal[-1]) and macd[-2] - signal[-2] > abs(0.02*signal[-2]):
curPosition = context.portfolio.positions[context.s1].quantity
if curPosition > 0:
order_lots(context.s1,-0.007*curPosition)
elif macd[-1] - signal[-1] < 0 and macd[-2] - signal[-2] > 0:
curPosition = context.portfolio.positions[context.s1].quantity
if curPosition > 0:
order_lots(context.s1,-0.005*curPosition)
|
优化三:延时处理
我在策略中加入了延时处理,即交易信号出现时延后一天再交易,其逻辑是或许信号刚出现时走势的变动还未显现,旧的走势仍在延续,此时交易为时尚在。
调整后相关代码如下:
1
2
3
4
5
6
7
8
9
10
11
12
13
14
15
16
17
18
19
| if macd[-2] - signal[-2] > abs(0.05*signal[-2]) and macd[-3] - signal[-3] < -abs(0.05*signal[-3]):
order_target_percent(context.s1, 1)
elif macd[-2] - signal[-2] > abs(0.03*signal[-2]) and macd[-3] - signal[-3] < -abs(0.03*signal[-3]):
order_target_percent(context.s1, 0.8)
elif macd[-2] - signal[-2] > 0 and macd[-3] - signal[-3] < 0:
order_target_percent(context.s1, 0.6)
if macd[-2] - signal[-2] < -abs(0.05*signal[-2]) and macd[-3] - signal[-3] > abs(0.05*signal[-3]):
curPosition = context.portfolio.positions[context.s1].quantity
if curPosition > 0:
order_target_value(context.s1, 0)
elif macd[-2] - signal[-2] < -abs(0.02*signal[-2]) and macd[-3] - signal[-3] > abs(0.02*signal[-3]):
curPosition = context.portfolio.positions[context.s1].quantity
if curPosition > 0:
order_lots(context.s1,-0.007*curPosition)
elif macd[-2] - signal[-2] < 0 and macd[-3] - signal[-3] > 0:
curPosition = context.portfolio.positions[context.s1].quantity
if curPosition > 0:
order_lots(context.s1,-0.005*curPosition)
|
经过上述优化后,新的结果如下:
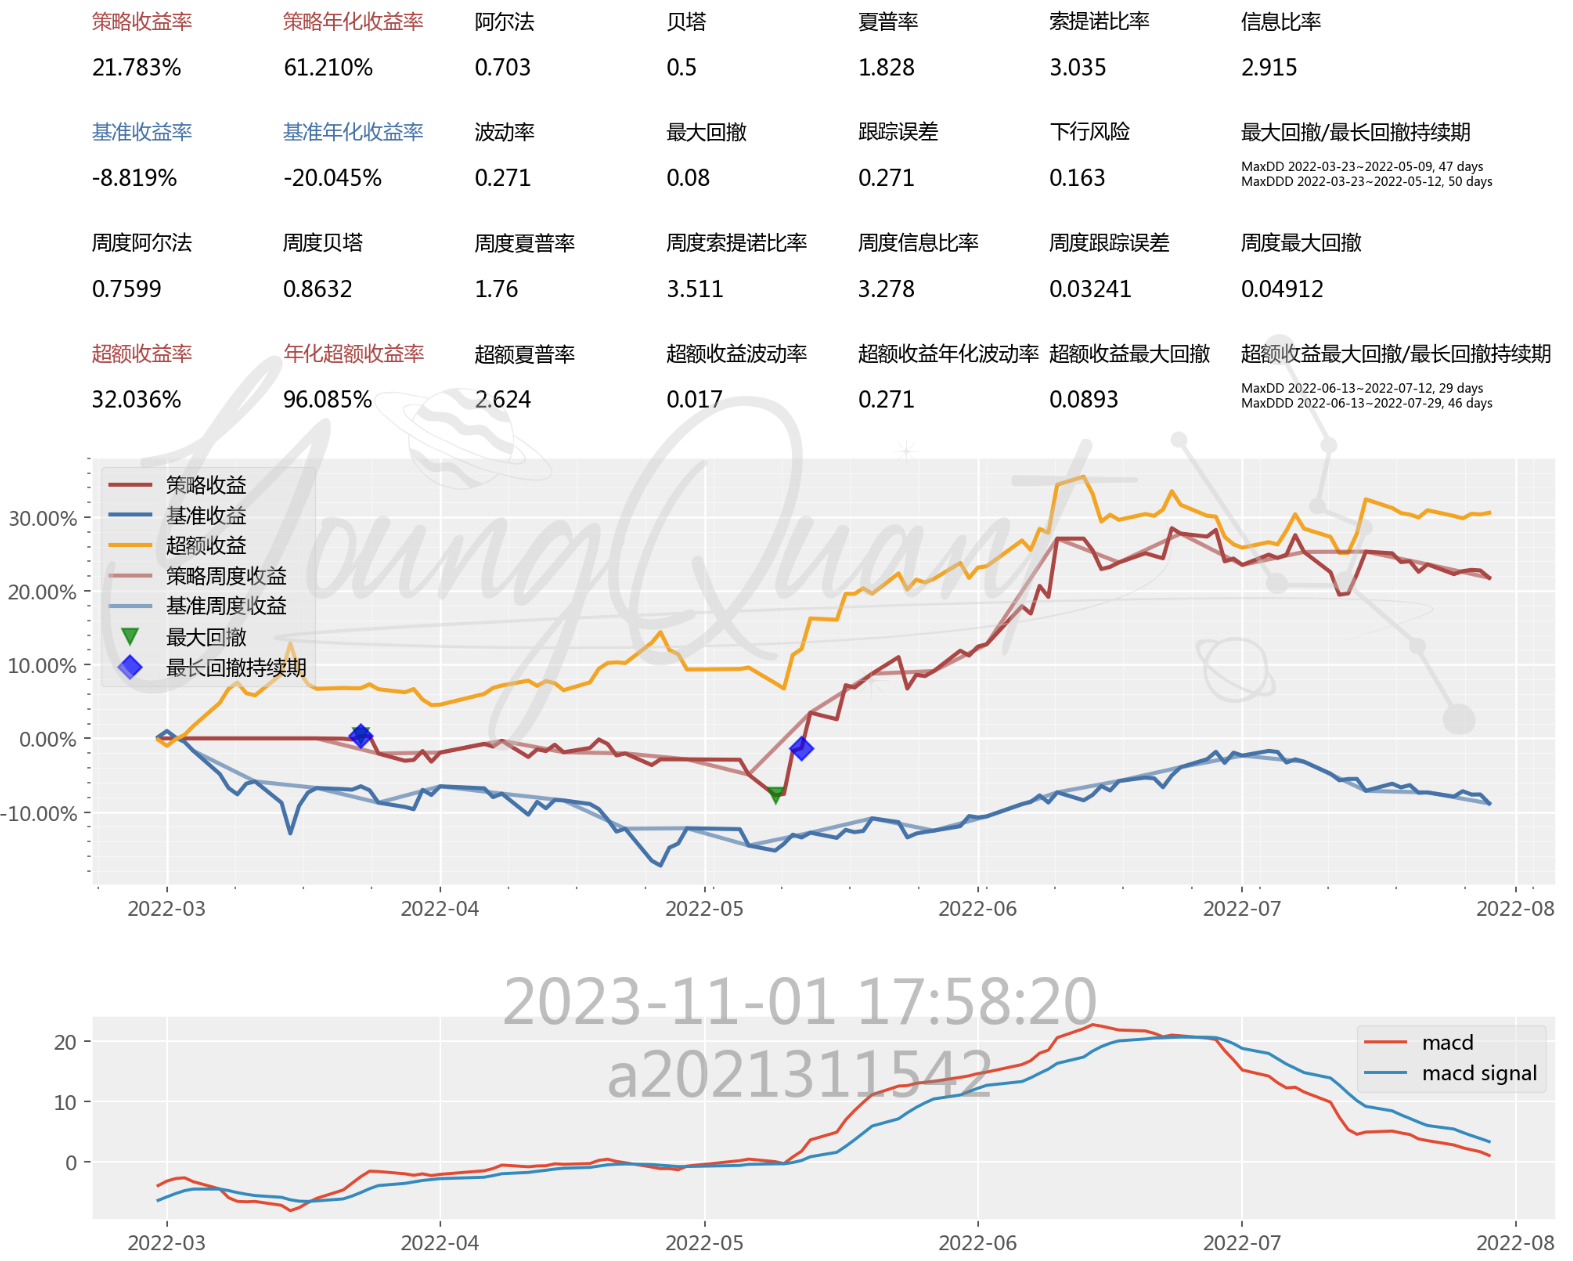
与原始策略进行对比,我们可以发现:
- 总体差异不大,优化后收益率略微降低,这是由我们仓位控制策略导致的,这种程度的降低是可以接受的。
- 波动率与最大回撤均有小幅度的降低,可以看出仓位的控制可以一定程度上降低风险。
- 信息比率有小幅上升,意味着在我们同时降低风险与收益的过程中,单位超额风险带来的超额收益是在增加的,由此可以认为我们的优化是正向的。
完整代码如下:
1
2
3
4
5
6
7
8
9
10
11
12
13
14
15
16
17
18
19
20
21
22
23
24
25
26
27
28
29
30
31
32
33
34
35
36
37
38
39
40
41
42
43
44
45
46
47
48
49
50
51
52
53
54
55
56
57
58
59
60
61
62
63
64
65
66
67
68
69
70
71
72
73
| from youngquant.api import *
from youngquant import exec_strategy
import talib
config = {
"base": {
"start_date": "2022-02-28",
"end_date": "2022-07-31",
"frequency": "1d",
"accounts": {
"stock": 100000
}
},
"extra": {
"log_level": "warning",
},
"mod": {
"sys_progress":{
"enabled":True,
"show":True,
},
"sys_analyser": {
"enabled": True,
"benchmark": "000300.XSHG",
"plot": True
},
"mongodb": {
"enabled": True,
}
}
}
def initialize(context):
context.s1 = "002594.XSHE"
context.SHORTPERIOD = 14
context.LONGPERIOD = 30
context.SMOOTHPERIOD = 10
context.OBSERVATION = 800
def before_trading_start(context):
pass
def handle_data(context, bar_dict):
prices= history_bars(context.s1,context.OBSERVATION, '1d', 'close',adjust_type='pre')
macd, signal, hist = talib.MACD(prices, context.SHORTPERIOD,context.LONGPERIOD, context.SMOOTHPERIOD)
plot("macd", macd[-1])
plot("macd signal", signal[-1])
if macd[-2] - signal[-2] > abs(0.05*signal[-2]) and macd[-3] - signal[-3] < -abs(0.05*signal[-3]):
    order_target_percent(context.s1, 1)
elif macd[-2] - signal[-2] > abs(0.03*signal[-2]) and macd[-3] - signal[-3] < -abs(0.03*signal[-3]):
    order_target_percent(context.s1, 0.8)
elif macd[-2] - signal[-2] > 0 and macd[-3] - signal[-3] < 0:
    order_target_percent(context.s1, 0.6)

if macd[-2] - signal[-2] < -abs(0.05*signal[-2]) and macd[-3] - signal[-3] > abs(0.05*signal[-3]):
    curPosition = context.portfolio.positions[context.s1].quantity
    if curPosition > 0:
        order_target_value(context.s1, 0)
elif macd[-2] - signal[-2] < -abs(0.02*signal[-2]) and macd[-3] - signal[-3] > abs(0.02*signal[-3]):
    curPosition = context.portfolio.positions[context.s1].quantity
    if curPosition > 0:
        order_lots(context.s1,-0.007*curPosition)
elif macd[-2] - signal[-2] < 0 and macd[-3] - signal[-3] > 0:
    curPosition = context.portfolio.positions[context.s1].quantity
    if curPosition > 0:
        order_lots(context.s1,-0.005*curPosition)
exec_strategy(initialize=initialize, before_trading_start=before_trading_start, handle_data=handle_data, config=config)
|
附录
1
2
3
4
5
6
7
8
9
10
11
12
13
14
15
16
17
18
19
20
21
22
23
24
25
26
27
28
29
30
31
32
33
34
35
36
37
38
39
40
41
42
43
44
45
46
47
48
49
50
51
52
53
54
55
56
57
58
59
60
61
62
63
64
65
66
67
68
69
70
71
72
73
74
75
76
77
78
79
80
81
82
83
84
85
86
87
88
89
90
91
92
93
94
95
96
97
98
99
100
101
102
103
104
105
106
107
108
109
110
111
112
113
114
115
116
117
118
119
120
121
122
123
124
125
126
127
128
129
130
131
132
133
134
135
136
137
138
139
140
141
142
143
144
145
146
147
148
149
150
151
152
| {'sys_analyser': {'summary': {'strategy_name': 'strategy',
'start_date': '2022-02-28',
'end_date': '2022-07-29',
'strategy_file': 'strategy.py',
'run_type': 'BACKTEST',
'STOCK': 100000.0,
'alpha': 0.703,
'beta': 0.5,
'sharpe': 1.828,
'excess_sharpe': 2.624,
'information_ratio': 2.915,
'downside_risk': 0.163,
'tracking_error': 0.271,
'sortino': 3.035,
'volatility': 0.271,
'excess_volatility': 0.017,
'excess_annual_volatility': 0.271,
'max_drawdown': 0.08,
'excess_max_drawdown': 0.0893,
'excess_returns': 0.320357,
'excess_annual_returns': 0.96085,
'total_value': 121783.0536,
'cash': 57711.0536,
'total_returns': 0.217831,
'annualized_returns': 0.6121,
'unit_net_value': 1.2178,
'units': 100000.0,
'benchmark_total_returns': -0.088188,
'benchmark_annualized_returns': -0.200447,
'weekly_alpha': 0.7599176382367852,
'weekly_beta': 0.863162860601842,
'weekly_sharpe': 1.7597007236570446,
'weekly_sortino': 3.5106484940468463,
'weekly_information_ratio': 3.2782757079433917,
'weekly_tracking_error': 0.032414898455319294,
'weekly_max_drawdown': 0.049123999999999834},
'trades': trading_datetime order_book_id symbol side \
datetime
2022-03-21 15:00:00 2022-03-21 15:00:00 002594.XSHE 比亚迪 BUY
2022-04-26 15:00:00 2022-04-26 15:00:00 002594.XSHE 比亚迪 SELL
2022-05-05 15:00:00 2022-05-05 15:00:00 002594.XSHE 比亚迪 BUY
2022-06-28 15:00:00 2022-06-28 15:00:00 002594.XSHE 比亚迪 SELL
position_effect exec_id tax commission \
datetime
2022-03-21 15:00:00 OPEN 16988300590084 0.000 39.2608
2022-04-26 15:00:00 CLOSE 16988300590085 46.362 37.0896
2022-05-05 15:00:00 OPEN 16988300590086 0.000 59.7120
2022-06-28 15:00:00 CLOSE 16988300590087 35.290 28.2320
last_quantity last_price order_id \
datetime
2022-03-21 15:00:00 200 245.38 16988300590133
2022-04-26 15:00:00 200 231.81 16988300590134
2022-05-05 15:00:00 300 248.80 16988300590136
2022-06-28 15:00:00 100 352.90 16988300590137
transaction_cost
datetime
2022-03-21 15:00:00 39.2608
2022-04-26 15:00:00 83.4516
2022-05-05 15:00:00 59.7120
2022-06-28 15:00:00 63.5220 ,
'portfolio': cash total_value market_value unit_net_value units \
date
2022-02-28 100000.0000 100000.0000 0.0 1.000000 100000.0
2022-03-01 100000.0000 100000.0000 0.0 1.000000 100000.0
2022-03-02 100000.0000 100000.0000 0.0 1.000000 100000.0
2022-03-03 100000.0000 100000.0000 0.0 1.000000 100000.0
2022-03-04 100000.0000 100000.0000 0.0 1.000000 100000.0
... ... ... ... ... ...
2022-07-25 57690.0536 122280.0536 64590.0 1.222801 100000.0
2022-07-26 57690.0536 122690.0536 65000.0 1.226901 100000.0
2022-07-27 57690.0536 122850.0536 65160.0 1.228501 100000.0
2022-07-28 57690.0536 122776.0536 65086.0 1.227761 100000.0
2022-07-29 57711.0536 121783.0536 64072.0 1.217831 100000.0
static_unit_net_value
date
2022-02-28 1.0000
2022-03-01 1.0000
2022-03-02 1.0000
2022-03-03 1.0000
2022-03-04 1.0000
... ...
2022-07-25 1.2361
2022-07-26 1.2228
2022-07-27 1.2269
2022-07-28 1.2285
2022-07-29 1.2278
[104 rows x 6 columns],
'benchmark_portfolio': unit_net_value
date
2022-02-28 1.001798
2022-03-01 1.010115
2022-03-02 1.001132
2022-03-03 0.995234
2022-03-04 0.983165
... ...
2022-07-25 0.921114
2022-07-26 0.928402
2022-07-27 0.923823
2022-07-28 0.923963
2022-07-29 0.911812
[104 rows x 1 columns],
'plots': macd macd signal
date
2022-02-28 -3.922977 -6.377851
2022-03-01 -3.170101 -5.794623
2022-03-02 -2.751273 -5.241287
2022-03-03 -2.621331 -4.764931
2022-03-04 -3.278636 -4.494696
... ... ...
2022-07-25 2.822480 5.463035
2022-07-26 2.357256 4.898348
2022-07-27 2.014850 4.374075
2022-07-28 1.694450 3.886871
2022-07-29 1.077986 3.375136
[104 rows x 2 columns],
'stock_account': cash transaction_cost market_value total_value
date
2022-02-28 100000.0000 0.0 0.0 100000.0000
2022-03-01 100000.0000 0.0 0.0 100000.0000
2022-03-02 100000.0000 0.0 0.0 100000.0000
2022-03-03 100000.0000 0.0 0.0 100000.0000
2022-03-04 100000.0000 0.0 0.0 100000.0000
... ... ... ... ...
2022-07-25 57690.0536 0.0 64590.0 122280.0536
2022-07-26 57690.0536 0.0 65000.0 122690.0536
2022-07-27 57690.0536 0.0 65160.0 122850.0536
2022-07-28 57690.0536 0.0 65086.0 122776.0536
2022-07-29 57711.0536 0.0 64072.0 121783.0536
[104 rows x 4 columns],
'stock_positions': order_book_id symbol quantity last_price avg_price market_value
date
2022-03-21 002594.XSHE 比亚迪 200.0 245.38 245.380 49076.0
2022-03-22 002594.XSHE 比亚迪 200.0 244.80 245.380 48960.0
2022-03-23 002594.XSHE 比亚迪 200.0 247.17 245.380 49434.0
2022-03-24 002594.XSHE 比亚迪 200.0 247.08 245.380 49416.0
2022-03-25 002594.XSHE 比亚迪 200.0 235.31 245.380 47062.0
... ... ... ... ... ... ...
2022-07-25 002594.XSHE 比亚迪 200.0 322.95 248.800 64590.0
2022-07-26 002594.XSHE 比亚迪 200.0 325.00 248.800 65000.0
2022-07-27 002594.XSHE 比亚迪 200.0 325.80 248.800 65160.0
2022-07-28 002594.XSHE 比亚迪 200.0 325.43 248.800 65086.0
2022-07-29 002594.XSHE 比亚迪 200.0 320.36 248.695 64072.0
[85 rows x 6 columns]}}
|
 求求富哥打赏~QwQ